Investor survey Solvency II Tier 1
Crédit Agricole CIB DCM Solutions conducted an investor survey on Solvency II Tier 1 hybrid instruments in January and we are pleased to present the results here.
Perception of relative value vs. outstanding undated Tier 2 instruments and bank AT1s
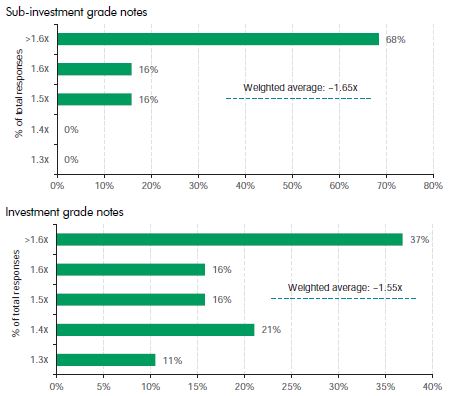
When comparing Solvency II Tier 1 with undated Solvency II Tier 2, the majority of survey respondents assess the potential multiple at approximately 1.55x for investment grade notes, and 1.65x for subinvestment grade notes. Nevertheless, the results show a high variance, especially on the investment grade side, which signals that the investor perception of the product is still developing.
In terms of loss absorption mechanism, investor friendly formats (temporary write-down, equity conversion) can carry an average 40bp premium over the permanent write-down structure for Solvency II Tier 1 instruments.
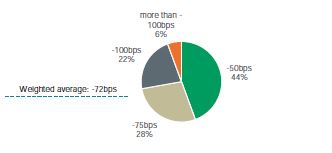
Respondents appear to appreciate the structural differences with bank AT1 instruments, mostly stemming from the absence of MDA restrictions on coupons, and lower constraints on write-up mechanism. 44% of the respondents see a Solvency II Tier 1 50bp tighter than a bank AT1 and 28% value the differential at 75bp.
For information on survey participants, please see below.
Where should a Solvency II Tier 1 trade, relative to an undated Solvency II Tier 2 instrument, to compensate for the loss absorption features (fully discretionary non-cum coupons and trigger-based principal loss absorption)?
Perception of the main risk drivers of the spread differential
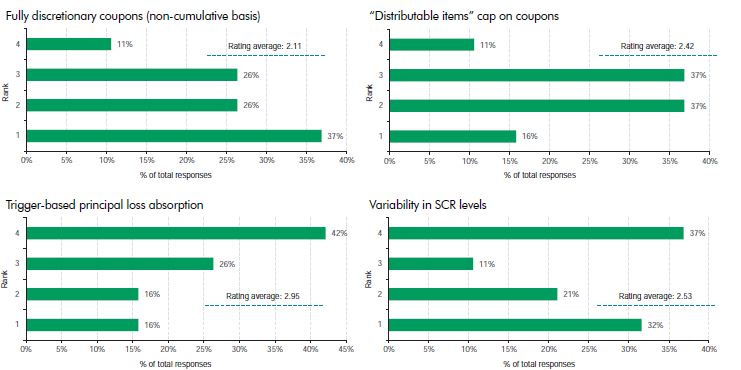
Respondents mainly identified potential restrictions on coupons (full discretion and distributable items cap) as the main drivers of the differential between undated Solvency II Tier 2 and Solvency II Tier 1.
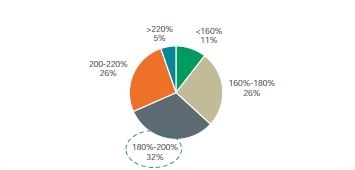
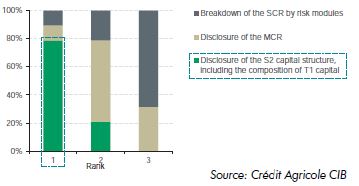
Given the definition of trigger events, the bulk of investors (64%) believe that the SCR Margin should be above 180%. e disclosure of the Solvency II capital structure, including the composition of Tier 1 capital, was identified as the most important factor in the investors’ analysis of an insurance capital instrument.
How do you rank the following drivers of the differential estimated in the previous question? (1 being the most important and 4 being the least important)
Given the definition of Solvency II Trigger Events, where should the SCR Margin be?
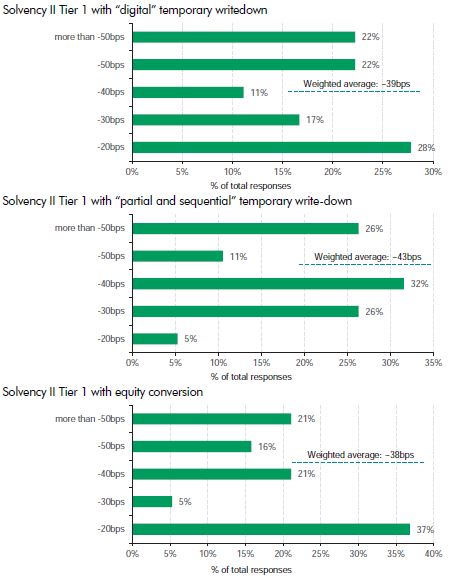
A Solvency II Tier 1 may be considered as relatively more investor friendly than a bank AT1 instrument (absence of MDA restrictions on coupons, less constraints on write-up mechanism). Under current market conditions, and assuming an identical credit strength, how much would you value the spread difference between the two instruments?
In addition to the SCR Margin, how do you rank the following criteria in your analysis of an insurance capital instrument?
Relative costs of forms of loss absorption mechanisms
Investor friendly formats can carry an average 40bp premium over the permanent write-down structure for Solvency II Tier 1 instruments.
Use of optional ACSM clauses
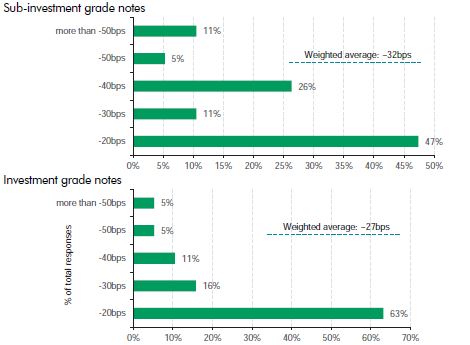
Based on the weighted average of the responses, an optional “Alternative Coupon Settlement Mechanism” (ACSM) clause could compress the Tier 1 premium by approximately 25bp-30bp and potentially more for sub-investment grade notes. This is in line with the findings on the perception of the main risk drivers, which indicate a focus on coupon cancellation risk.
Appetite for forms of loss absorption mechanisms
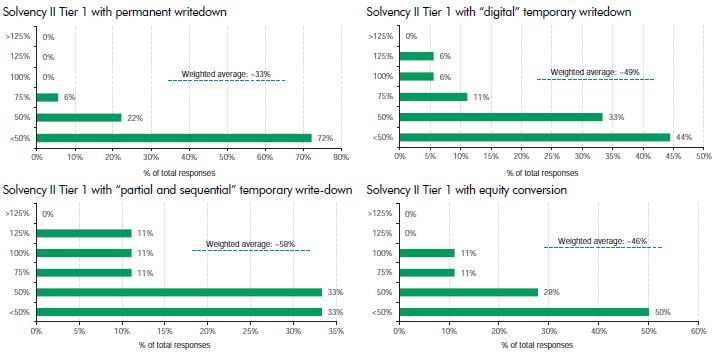
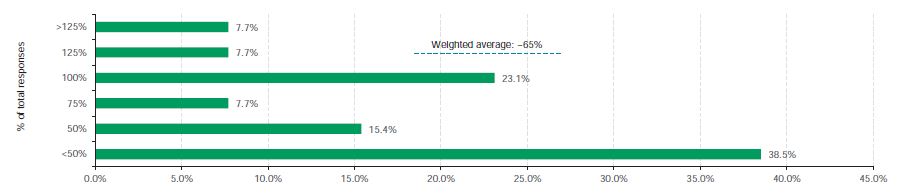
Overall, investors seem to show a lower appetite for Solvency II Tier 1 compared with undated Solvency II Tier 2, at least under current market conditions. In line with the results on relative value, permanent write-down is the least favoured loss absorption mechanism, as opposed to “partial and sequential” temporary write-down, which is confirmed to be the preferred format.
What would be your size appetite (as a percentage of your appetite for undated Solvency II Tier 2 instruments) for the following notes?
Solvency II Tier 3
We took this opportunity to also test investors’ perceptions of Solvency II Tier 3 instruments. Respondents seem to award an average 40bp spread differential to dated Solvency II Tier 3 instruments relative to dated Solvency II Tier 2 instruments with the same maturity. On the other hand, appetite appears to be in general more limited, although this could be the consequence of lower familiarity with the product.
Where should a 10 year Solvency II Tier 3 trade relative to a dated Solvency II Tier 2 instrument with an identical maturity?
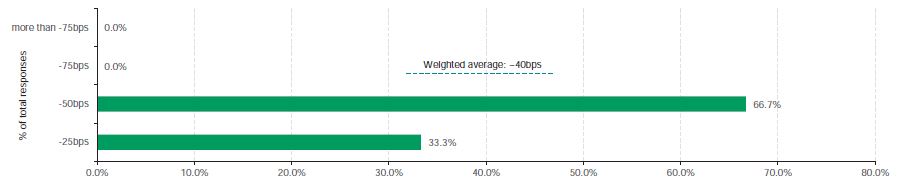
Where should a 10 year Solvency II Tier 3 trade relative to a dated Solvency II Tier 2 instrument with an identical maturity?
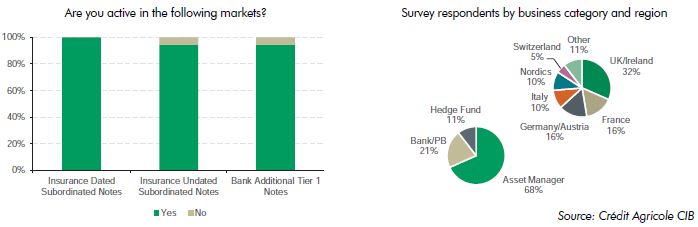
Respondent universe
We collected answers from a relevant sample of investors based in Europe (92%) and the US (8%), with the majority composed of asset managers (68%). All survey respondents are already active in insurance dated subordinated debt, 96% in insurance undated subordinated debt and 92% in bank Additional Tier 1 (AT1) instruments.
NB: Please note that, throughout the survey, weighted average figures assume mid-point of ranges or estimates based on the answers’ intervals